How a Query Executes and Reading EXPLAIN
What happens between typing a query and getting rows, and how to read an execution plan - the single most useful performance skill in SQL.
- SQL Basics
- DDL
- DML
- SELECT
- WHERE
- Functions
- NULL and Logic
- Aggregate Functions
- GROUP BY
- JOIN
- Subqueries
- Set Operations
- CTEs
- Constraints
- Keys
- Relationships
- Database Design
- Normalisation
- Views
- Window Functions
- Advanced SQL
- Procedures and Functions
- Triggers
- Temporary Tables
- Transactions
- Isolation and Locking
- Indexes
- Query Performance
- SQL Security
- SQL Dialects
- Practical SQL
Concept
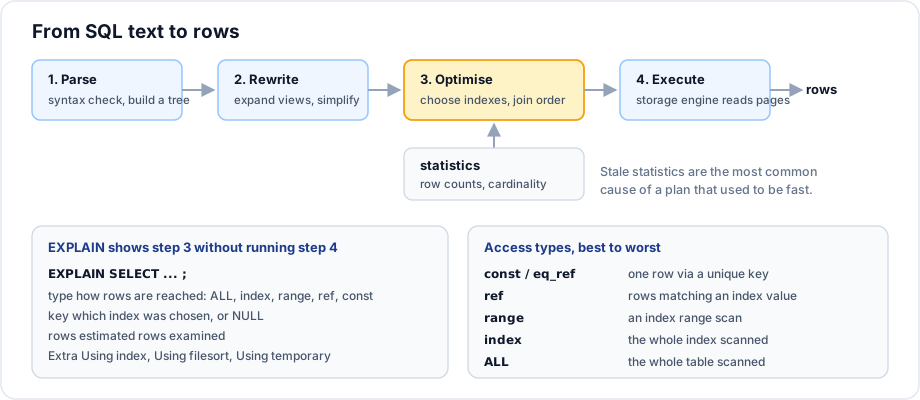
You describe what you want; the optimiser decides how to get it. EXPLAIN shows you that decision without running the query, which makes it the first tool to reach for whenever something is slow.
Syntax
EXPLAIN SELECT ...;                     -- the estimated plan
EXPLAIN ANALYZE SELECT ...;             -- MySQL 8.0.18+, PostgreSQL: runs it and shows actuals
EXPLAIN FORMAT=JSON SELECT ...;         -- MySQL: full cost detail
EXPLAIN (ANALYZE, BUFFERS) SELECT ...;  -- PostgreSQL
SET SHOWPLAN_ALL ON;                    -- SQL Server
Example
EXPLAIN
SELECT c.name, o.order_date, o.total
FROM   customers c
JOIN   orders o ON o.customer_id = c.id
WHERE  o.status = 'shipped'
ORDER BY o.order_date DESC;
Reading the output
| Column | Means | What you want |
|---|---|---|
type | How rows are reached | Anything but ALL on a large table |
key | The index chosen | Not NULL |
rows | Estimated rows examined | Close to the number returned |
filtered | Percent of examined rows that survive | High |
Extra | Extra work performed | Using index good; Using filesort, Using temporary suspicious |
Access types, best to worst
type | Meaning |
|---|---|
system / const | At most one row, via a primary or unique key |
eq_ref | One row from the joined table per outer row - a unique key join |
ref | Several rows matching an index value |
range | An index range scan (BETWEEN, >, IN) |
index | The entire index is scanned - better than ALL, still a full pass |
ALL | Full table scan. Fine on small tables, a red flag on large ones. |
The Extra column
| Value | Means |
|---|---|
Using index | Good - covering index, the table was never read |
Using where | Rows were filtered after being read - normal |
Using index condition | Index condition pushdown - the filter was applied at the index |
Using filesort | A sort was needed. Not always bad; bad on large results |
Using temporary | A temporary table was built, usually for GROUP BY or DISTINCT |
Using join buffer | The join had no usable index - almost always worth fixing |
Estimates versus reality
-- EXPLAIN estimates. EXPLAIN ANALYZE actually runs the query and reports what happened.
EXPLAIN ANALYZE
SELECT c.name, COUNT(*) AS orders
FROM   customers c
JOIN   orders o ON o.customer_id = c.id
GROUP BY c.name;

-- Output includes: actual time=..., rows=..., loops=...
When the estimated rows is wildly different from the actual, the statistics are stale. Run ANALYZE TABLE before concluding anything else is wrong.
Finding the queries to look at
-- MySQL: log statements slower than a threshold
SET GLOBAL slow_query_log = ON;
SET GLOBAL long_query_time = 1;          -- seconds

-- MySQL 8: the worst statements by total time
SELECT query, exec_count, total_latency, rows_sent_avg, rows_examined_avg
FROM   sys.statement_analysis
ORDER BY total_latency DESC LIMIT 10;

-- PostgreSQL, with pg_stat_statements enabled
SELECT query, calls, total_exec_time FROM pg_stat_statements
ORDER BY total_exec_time DESC LIMIT 10;
Optimise by total time, not worst single time. A query taking 50ms and running 100,000 times a minute matters far more than a 5 second report run nightly.
Important rules
EXPLAINdoes not execute the query (exceptEXPLAIN ANALYZE, which does).- Plans depend on statistics and on the actual data volume - a plan from a 100 row test database means nothing.
- The optimiser picks the plan it estimates cheapest; a full scan can genuinely be the right choice.
rowsis an estimate. Compare it with rows actually returned.- Plan output formats differ completely between products; the concepts transfer, the columns do not.
Common mistakes
- Guessing at the cause instead of reading the plan.
- Testing on an empty or tiny table.
- Chasing the slowest single query while ignoring the one running a million times an hour.
- Adding index hints to force a plan instead of fixing the statistics or the query.
- Ignoring
Using temporaryandUsing filesorton large result sets.
Best practices
- Read the plan before and after every change, and keep both.
- Refresh statistics with
ANALYZE TABLEwhen estimates look wrong. - Measure on production sized data.
- Drive the work from the slow query log, ordered by total time.
- Aim to make
rows examinedapproachrows returned; that ratio is the single best health metric for a query.
Practice
- Run
EXPLAINon a join in the sample schema and identify thetypeandkeyfor each table. - Force a
Using filesortwith anORDER BY, then remove it with an index. - Explain what a large gap between
rowsand rows returned tells you.